Discover the story behind your Ski SeasonsBikepacking TripsUltrasTraining CampsGravel RacesMarathons
Tell stories with your activity data.
Generate beautiful, shareable summaries from your Strava rides, runs and ski days in seconds.
What You Get
Everything you need to visualize and share your achievements
Tell Stories
Create a unique view of your activity with maps, summaries and comparisons.
Fun Comparisons
Burnt 30 pizzas worth of calories? Climbed 3 Mount Everests? We convert your stats into relatable comparisons your friends understand.
Shareable Cards
Beautiful cards perfect for social media. Screenshot worthy designs that make your achievements pop.
Powered by Strava
One-click connection. Secure, fast, and automatic. Your data stays private and safe.
New Features
We're trying out new features all the time. Get early access to the latest updates and improvements.
Yearly Stats
Generate your end of year cards and summaries to see how you ran, cycled or skied.
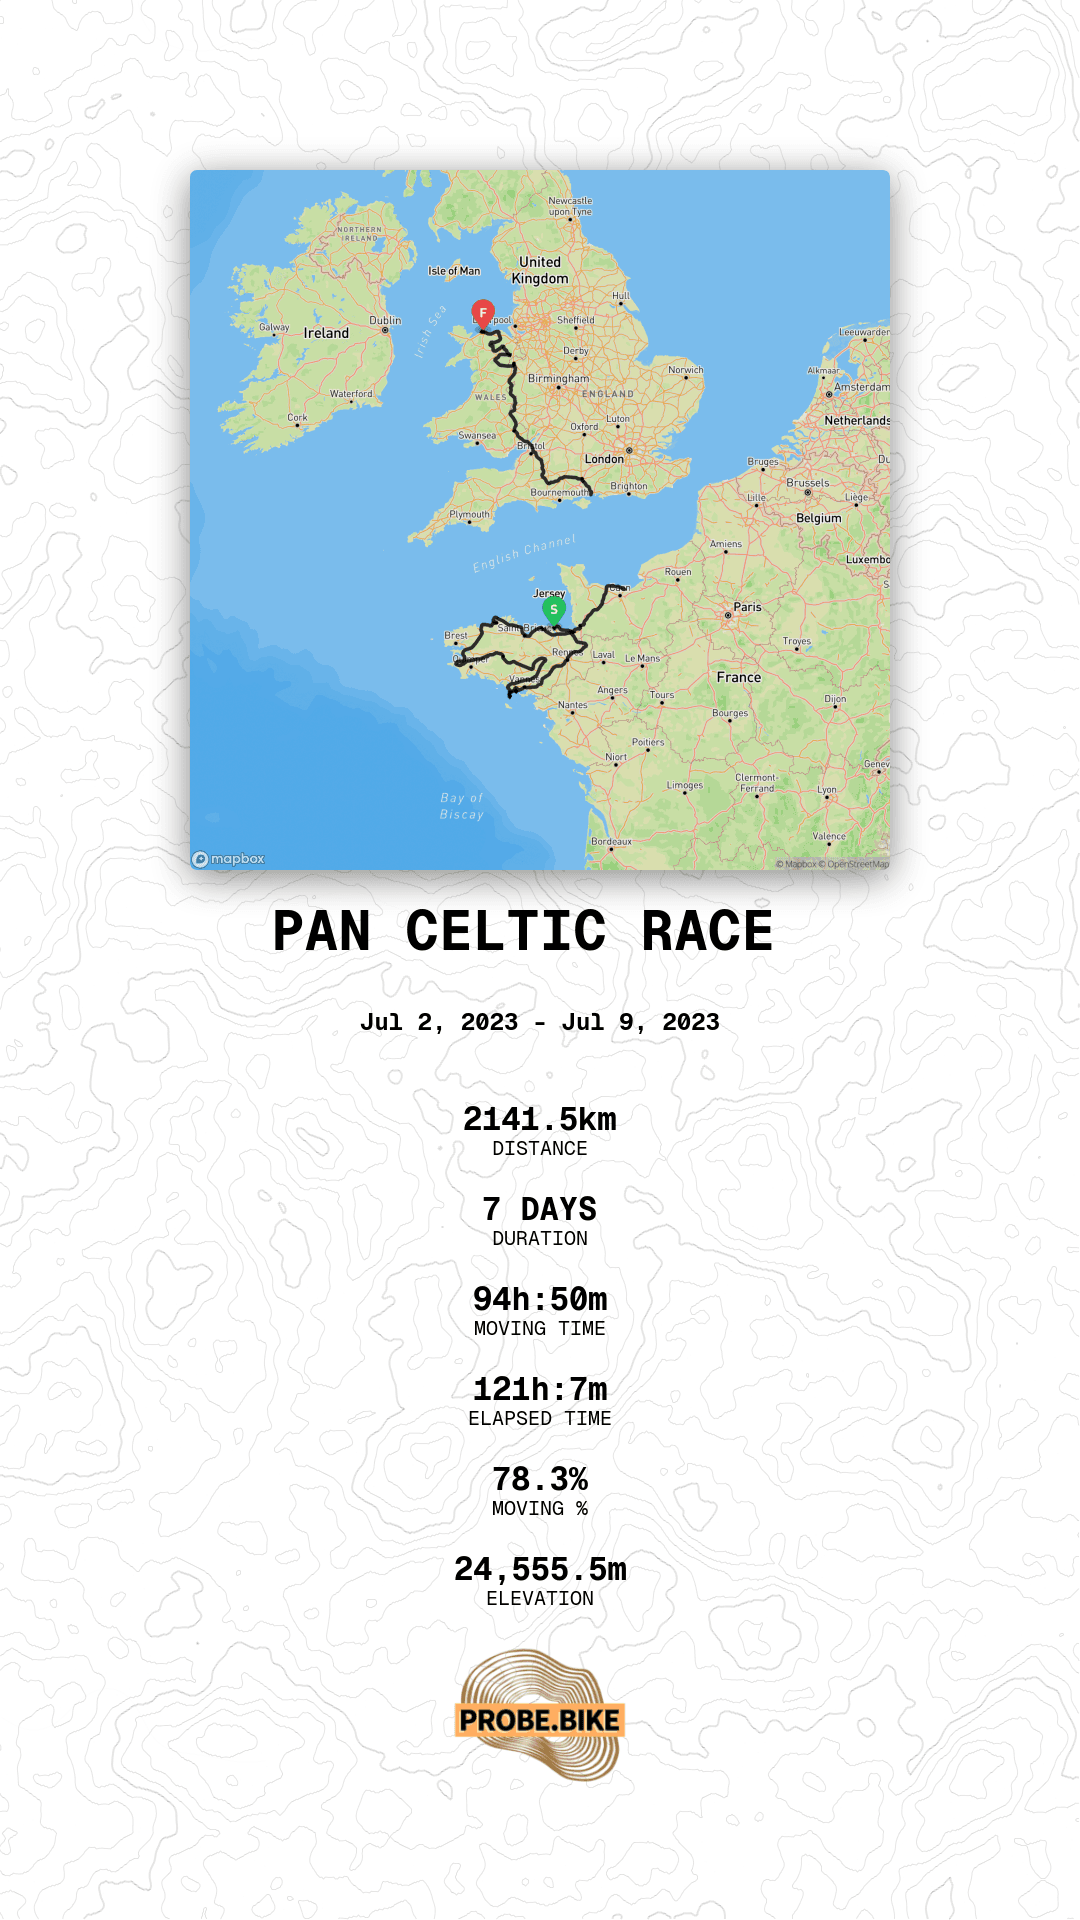
Turn a Whole Trip Into One Story
Strava shows a bikepacking trip, training camp or stage race as dozens of separate activities. We aggregate them into a single shareable card - route map, distance, elevation and time, all in one place.
- ✓Combine multiple activities across days
- ✓Route map with full trip stats
- ✓Instagram-story ready, generated in seconds
- ✓Perfect for tours, training camps and races
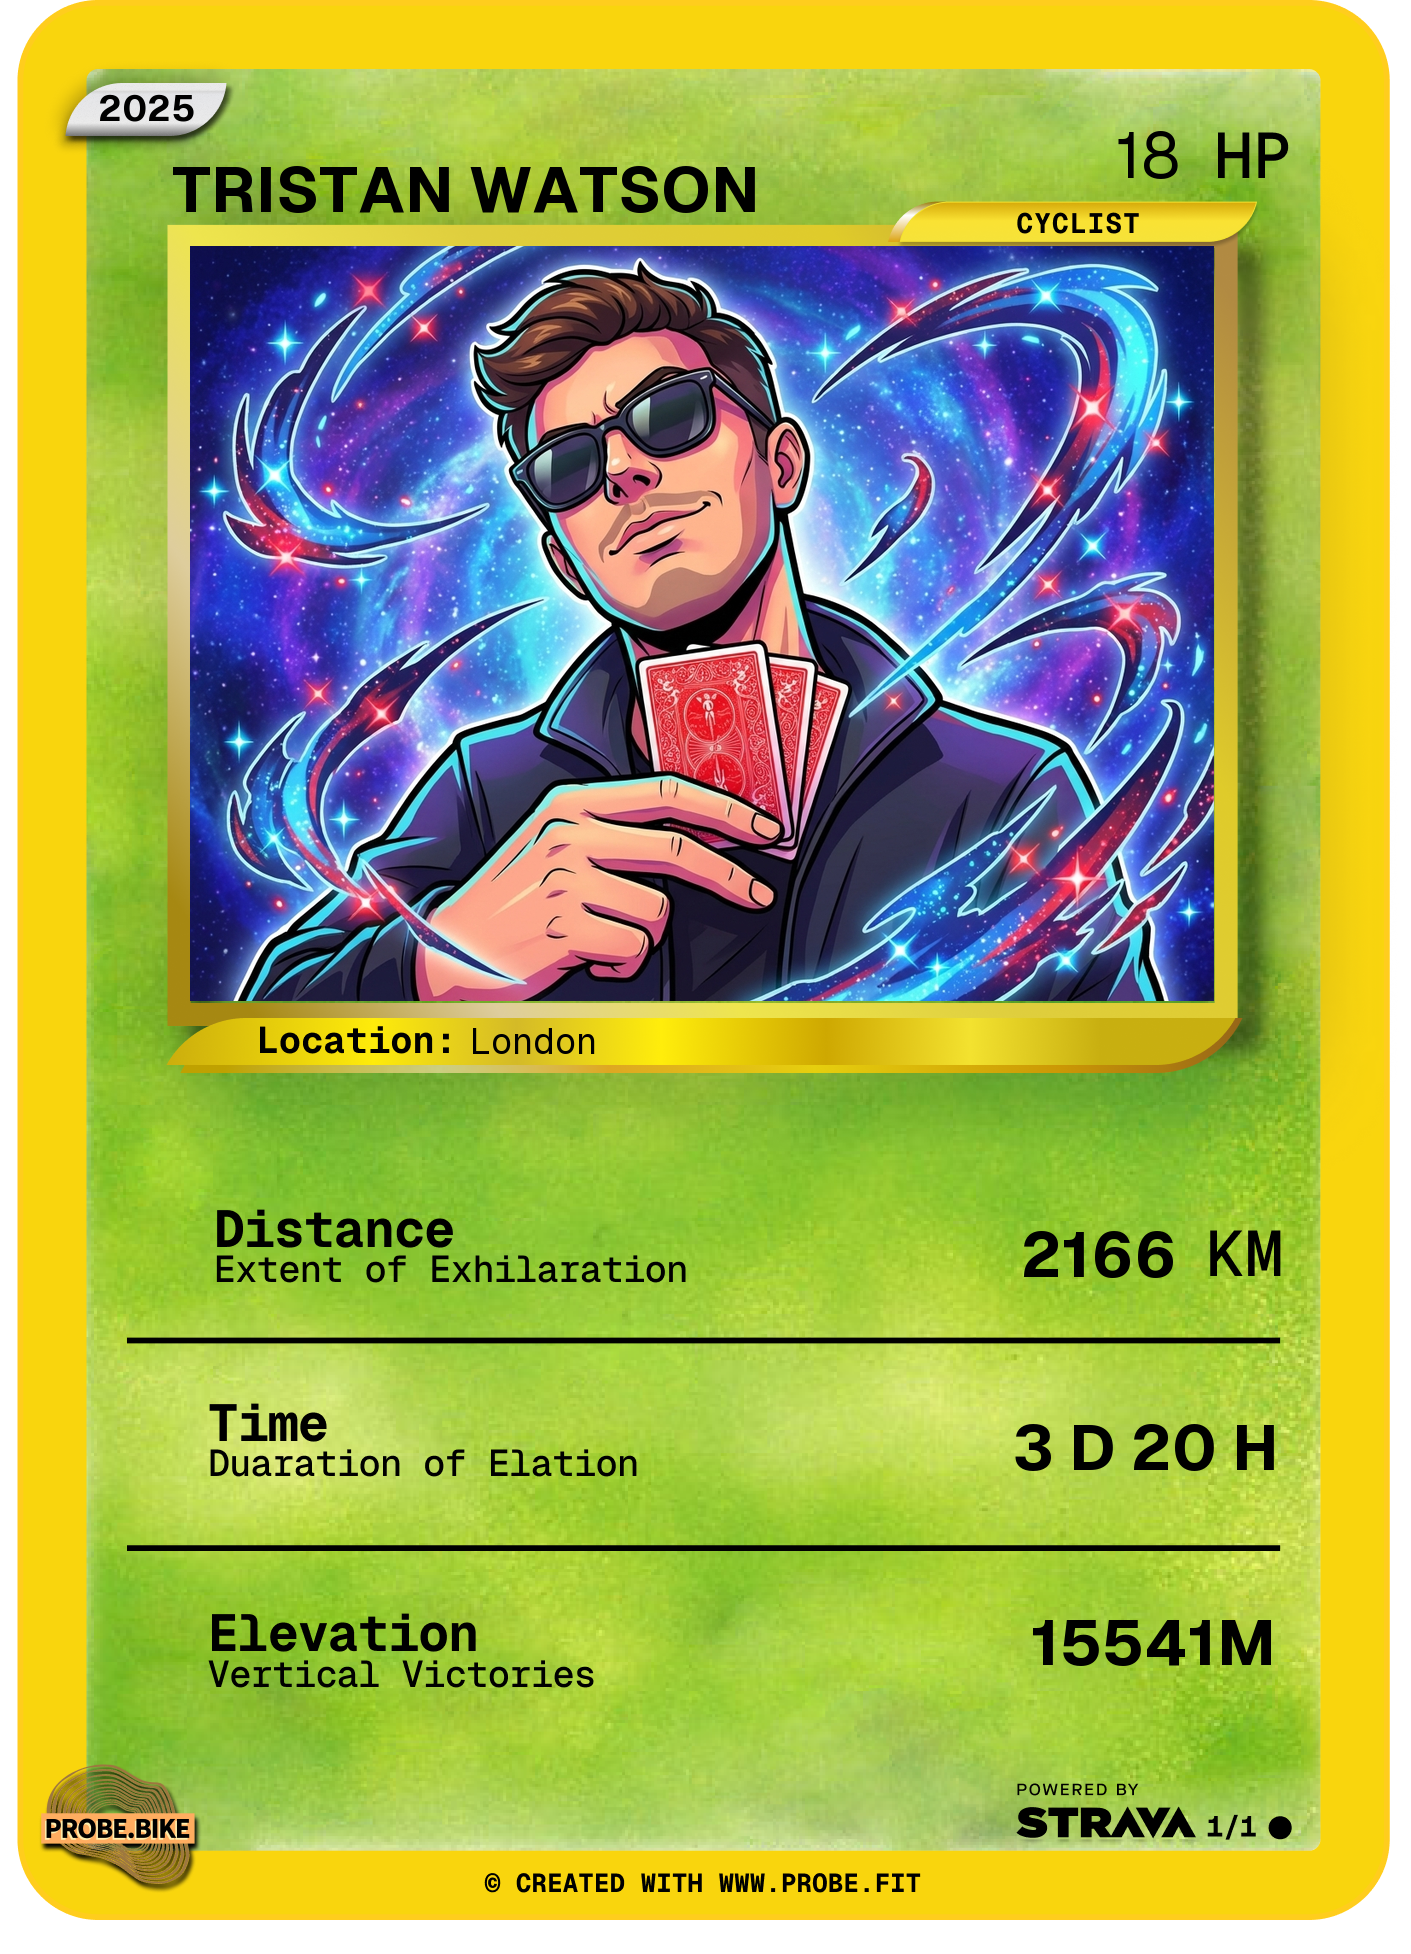
Your Year in a Card
Transform your achievements into a stunning collectible card. Distance, elevation, activities - all your yearly stats beautifully designed and ready to share.
- ✓Multiple card templates to choose from
- ✓AI-powered profile transformation
- ✓Perfect for Instagram, TikTok & more
- ✓Download in high resolution
How It Works
Get your yearly activity report in three simple steps
Connect with Strava
Click the button and authorize probe.fit to access your activity data. Takes 10 seconds.
We Do The Work
Our system analyzes your activities, calculates stats, and generates your beautiful yearly report automatically.
Share & Enjoy
Get your report via email and share your achievements. Download cards for social media in one click.
Ready to see your year wrapped?
"Finally, I can see how many pizzas I can eat!"